
The end of "let me pull that report."
Every question about projects, margins, and utilization. Answered instantly.
Meet Nitro Analyst
Nitro Analyst has your back in every boardroom.
Ask questions about your services business in plain language and get answers instantly across projects, resources and financials. No waiting until next week.
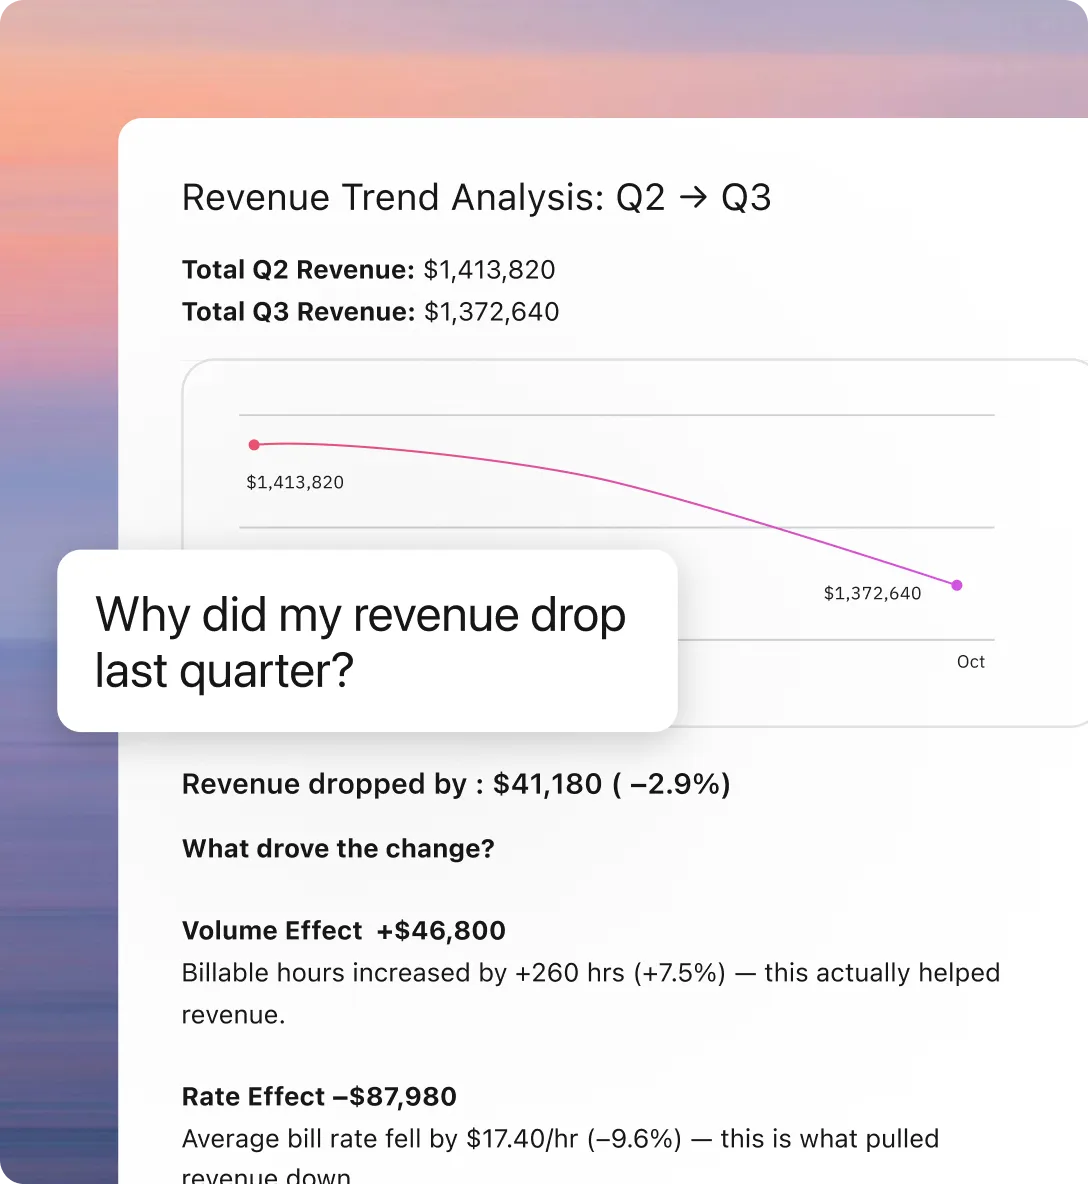
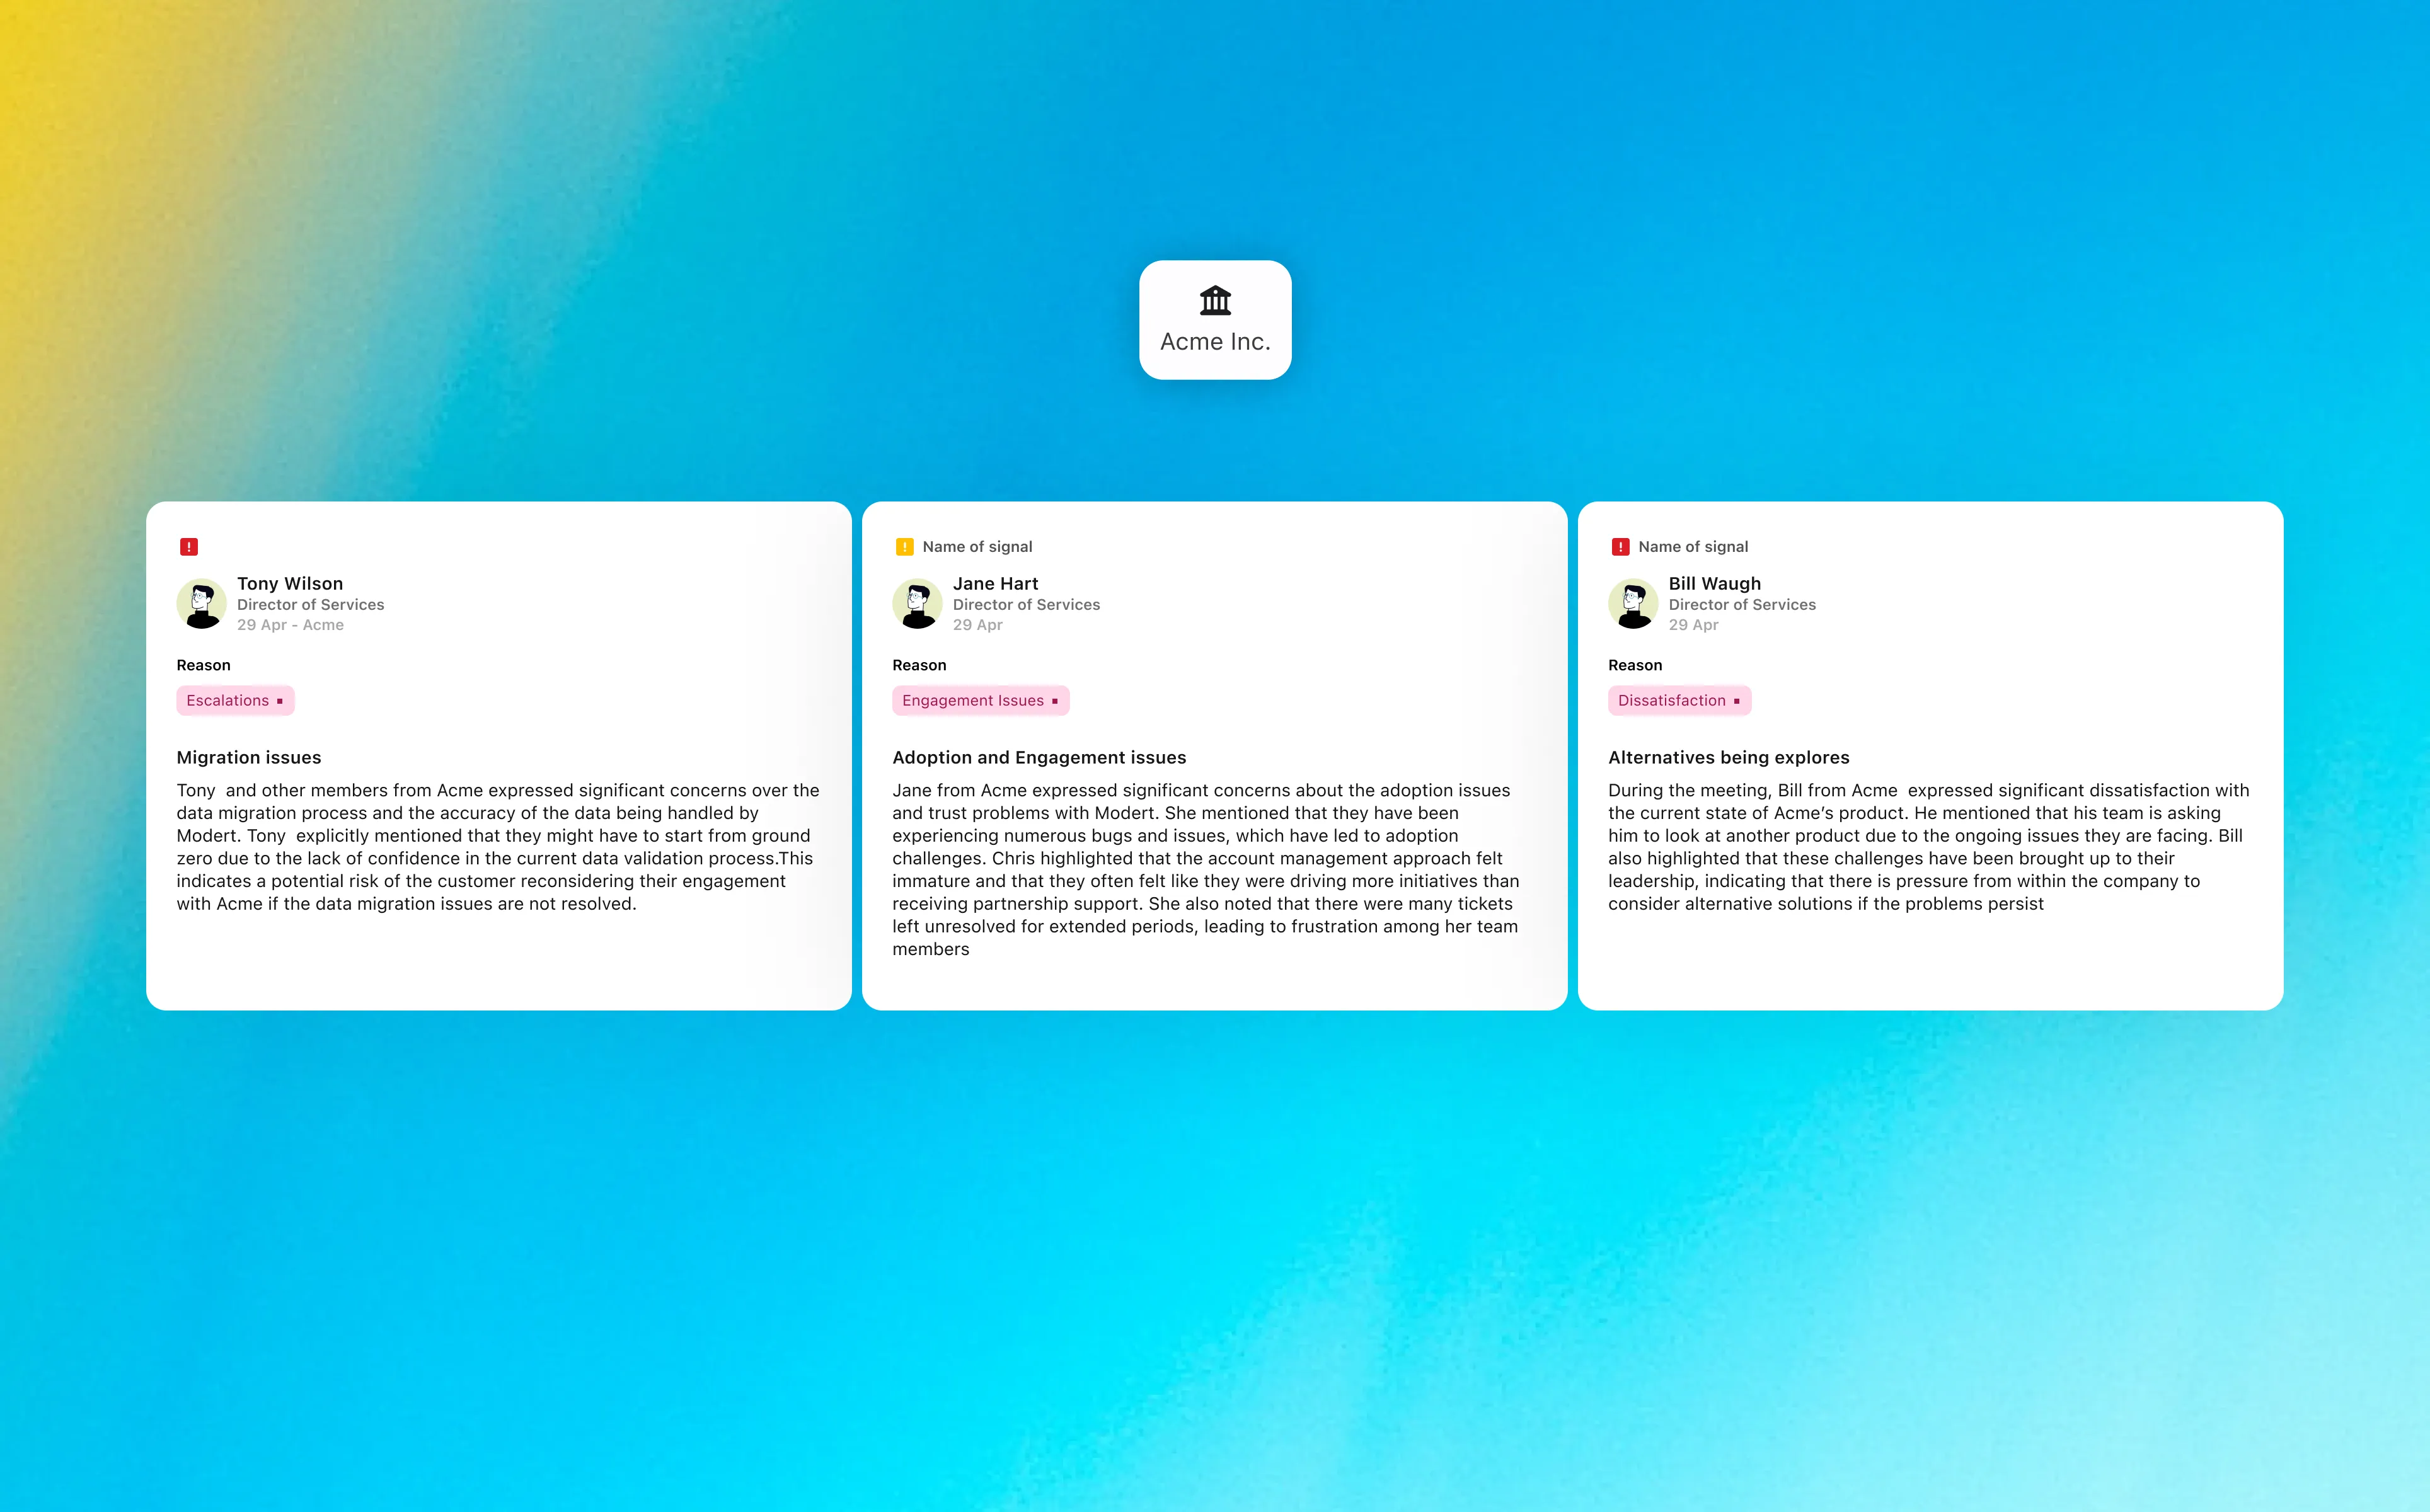
Traces the root cause of any margin and utilization variance in seconds
Margin slipping? Utilization off? A project trending over budget with no clear driver?
When a number moves, Nitro does not just show the delta.
It breaks down what drove it—scope shifts, resource mix, billing gaps, cost overruns. Across the projects where it is still happening, not after the quarter closes.
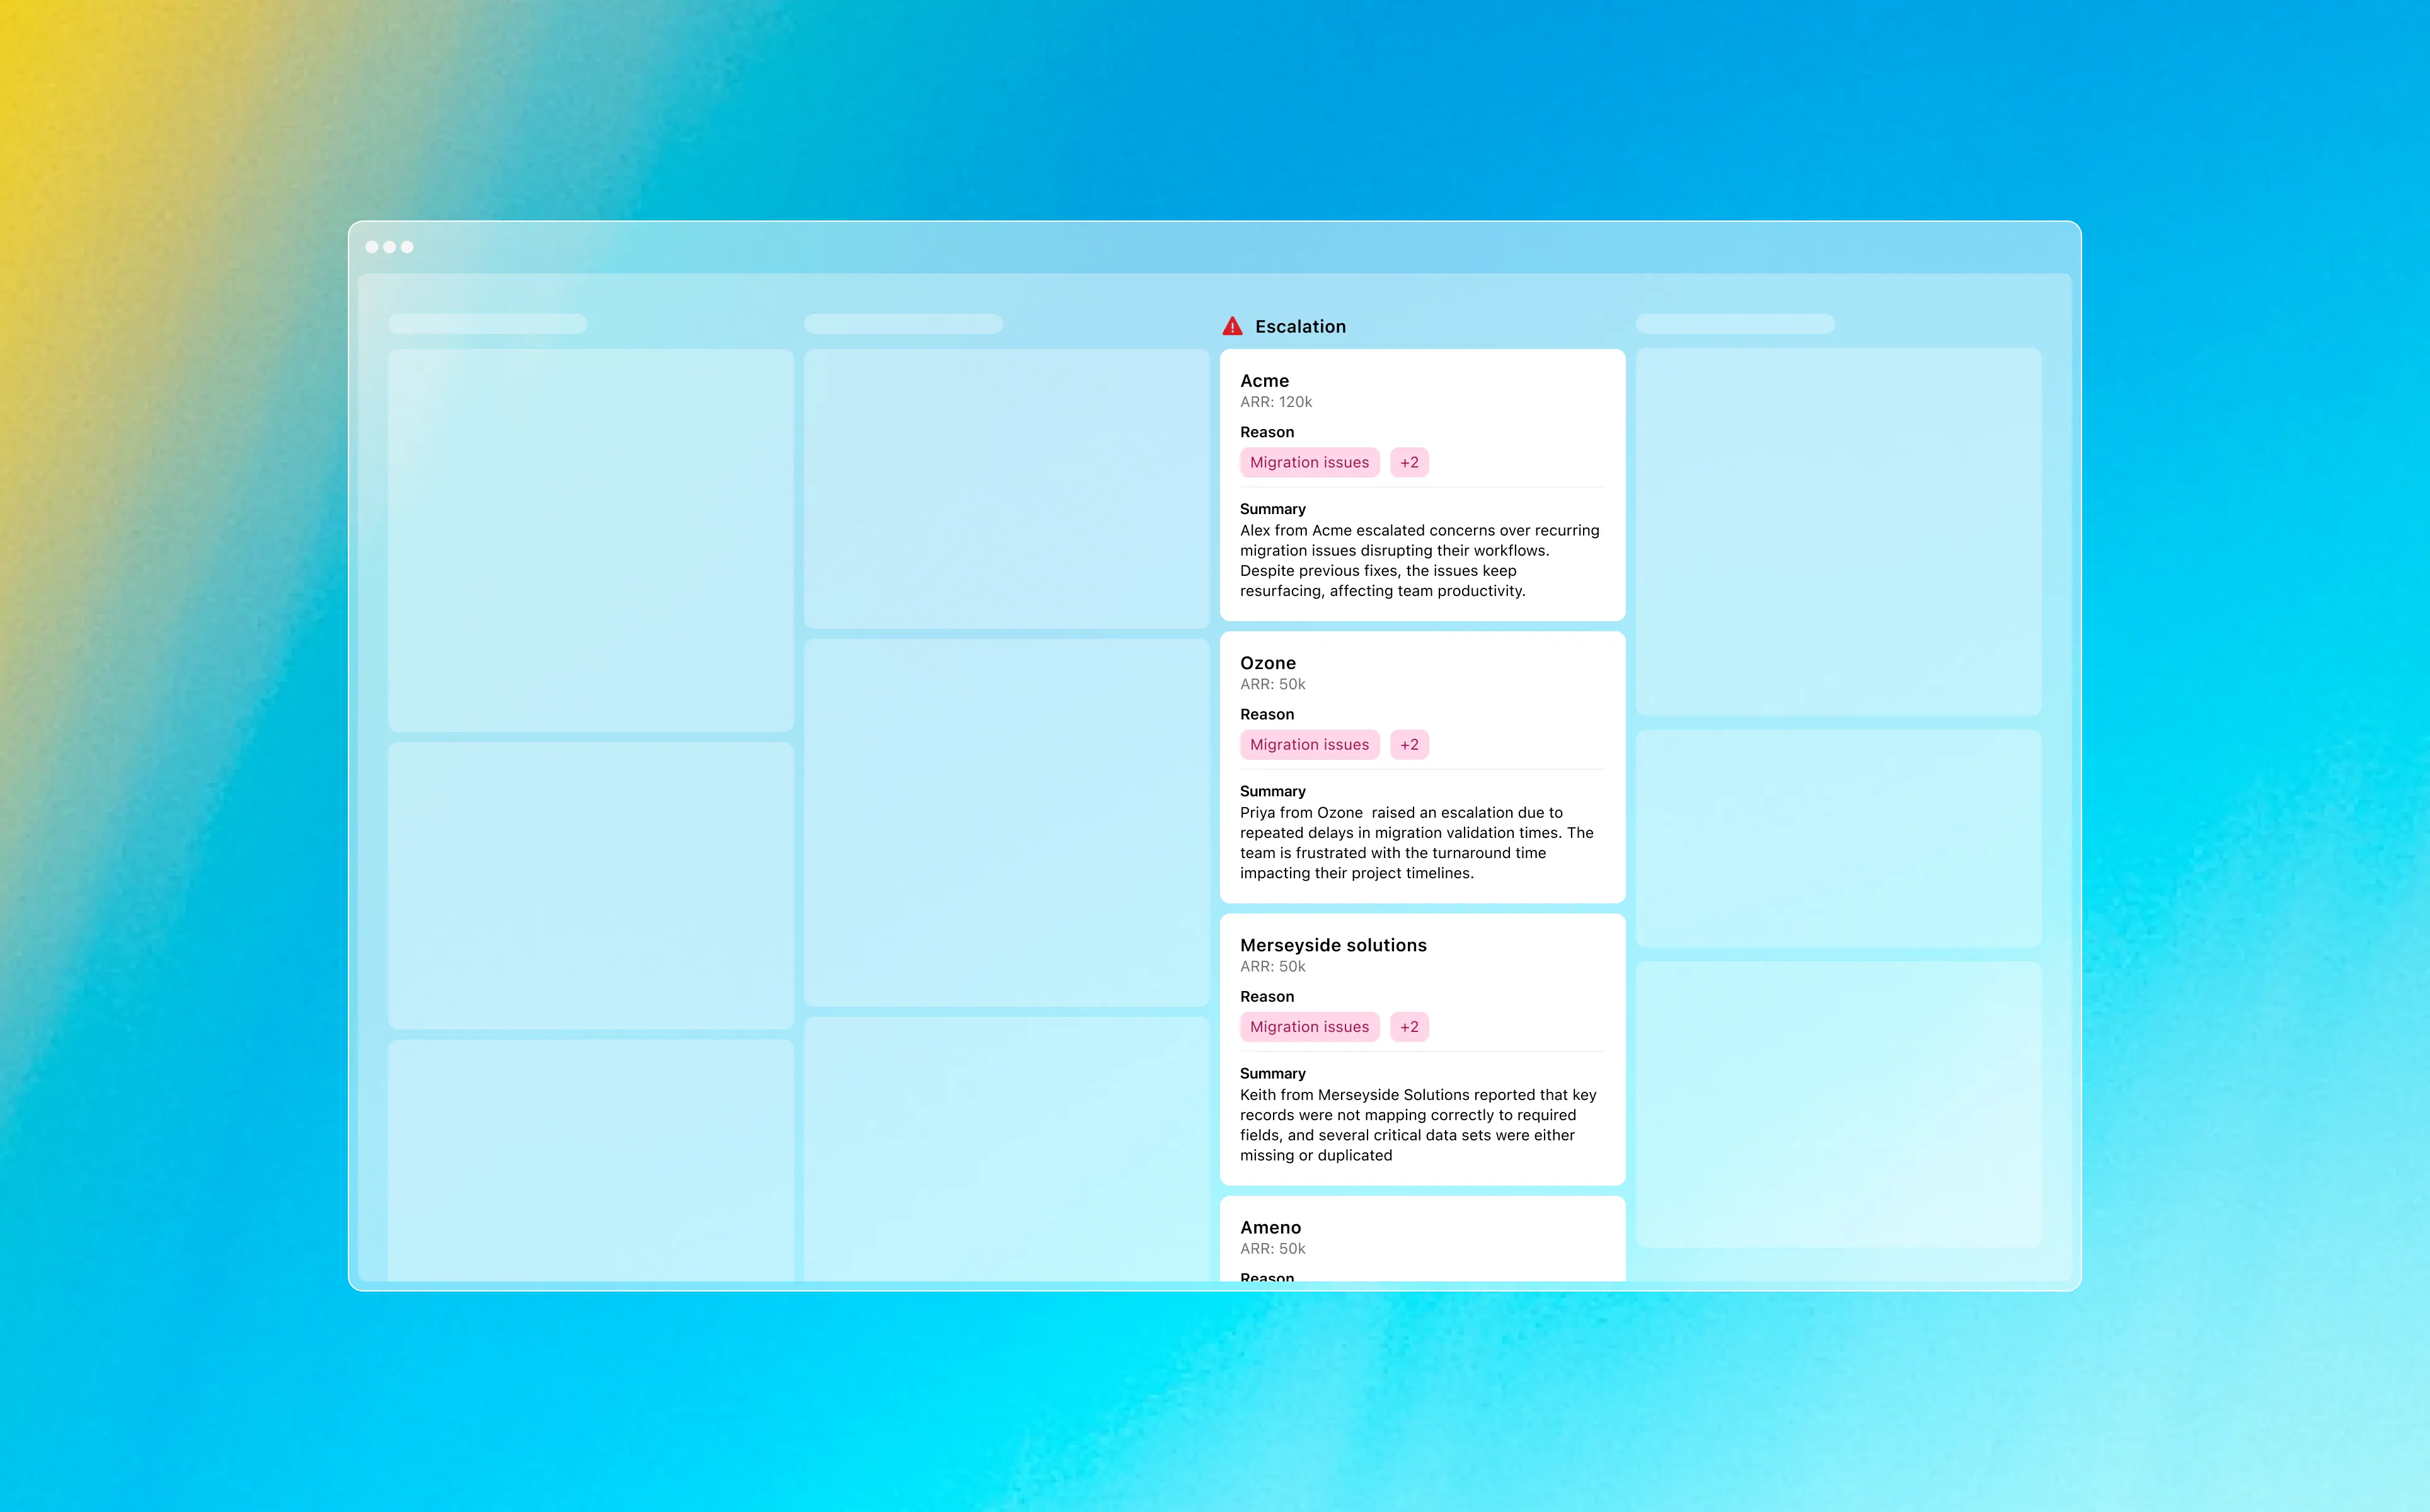
Answers the hard follow-up questions in every room instantly
Exec reviews do not end at the last slide. A number gets challenged. A follow-up comes in that was not on the deck.
No more "I'll get back to you." Pull up Nitro Analyst, get the answer, and keep the meeting moving.
All the way from the summary metric down to the exact projects, phases, and resources behind it.

Runs every recurring report the way your best analyst would
The report you ran last quarter should not need to be rebuilt this quarter.
Your teams often run the same utilization analysis, QBR breakdowns, and variance explanations again and again.
Save the logic once.
Nitro runs that analysis automatically on live data. The answer is ready whenever you need it.
.webp)
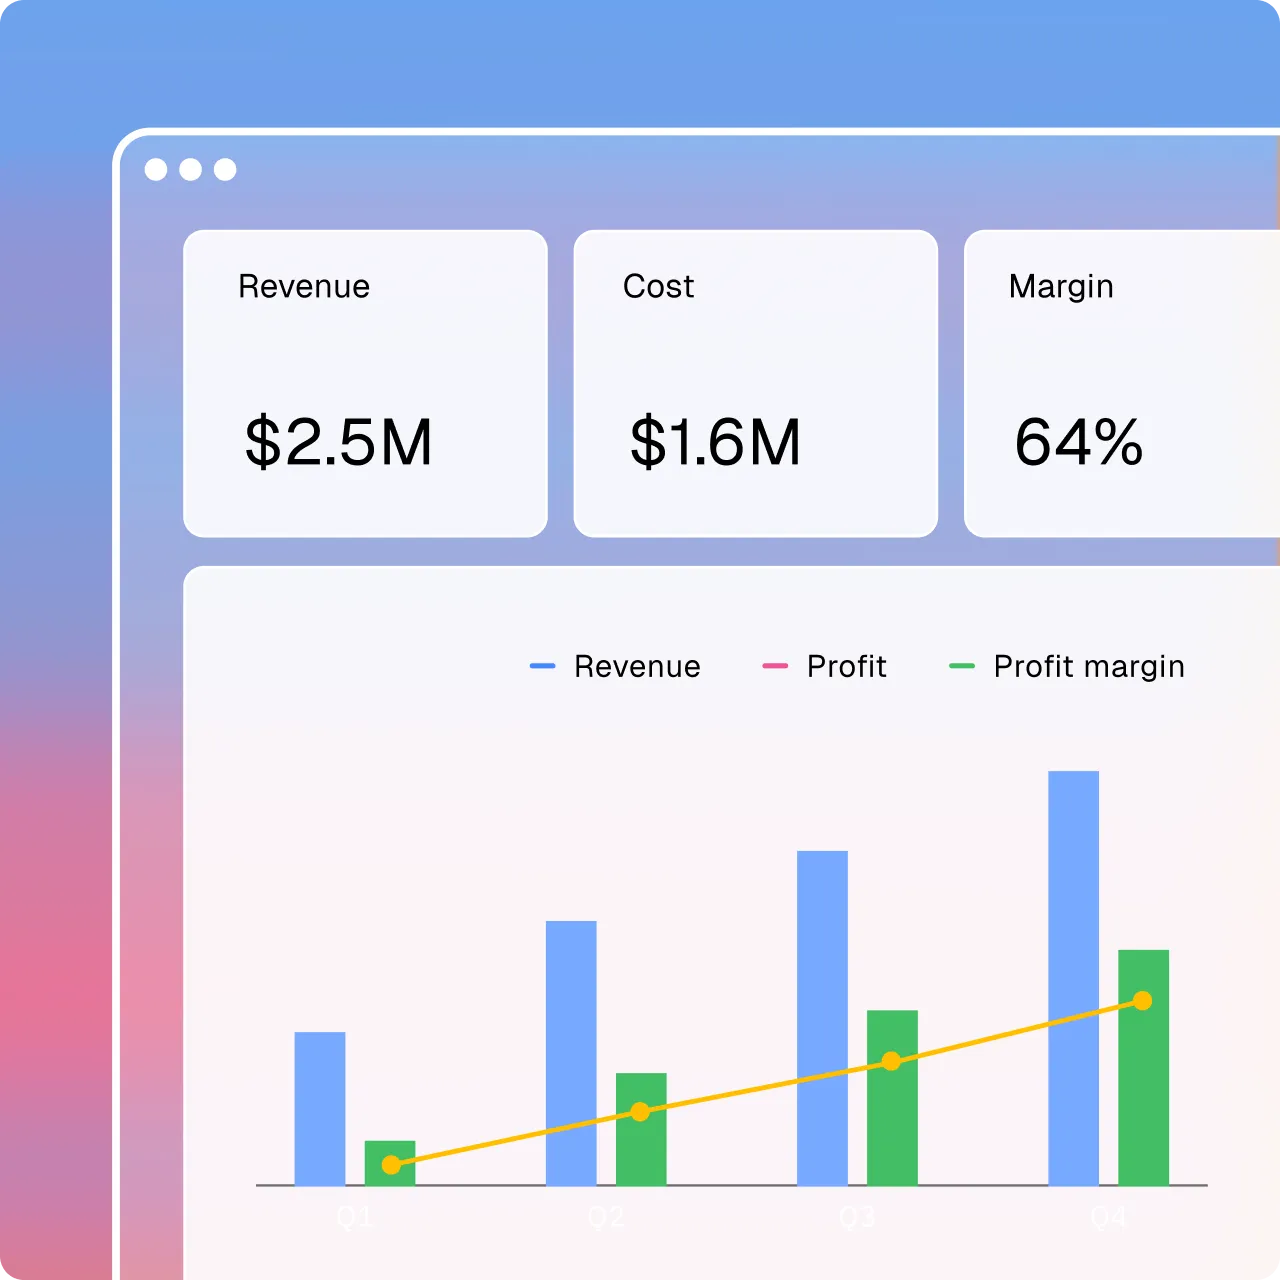
Steer your projects towards maximum profitability
See how every project contributes to your margins as work progresses, not after it’s done.
Rocketlane unifies project, people, time, and finance data so you always have an accurate picture of where you stand and where it’s headed.
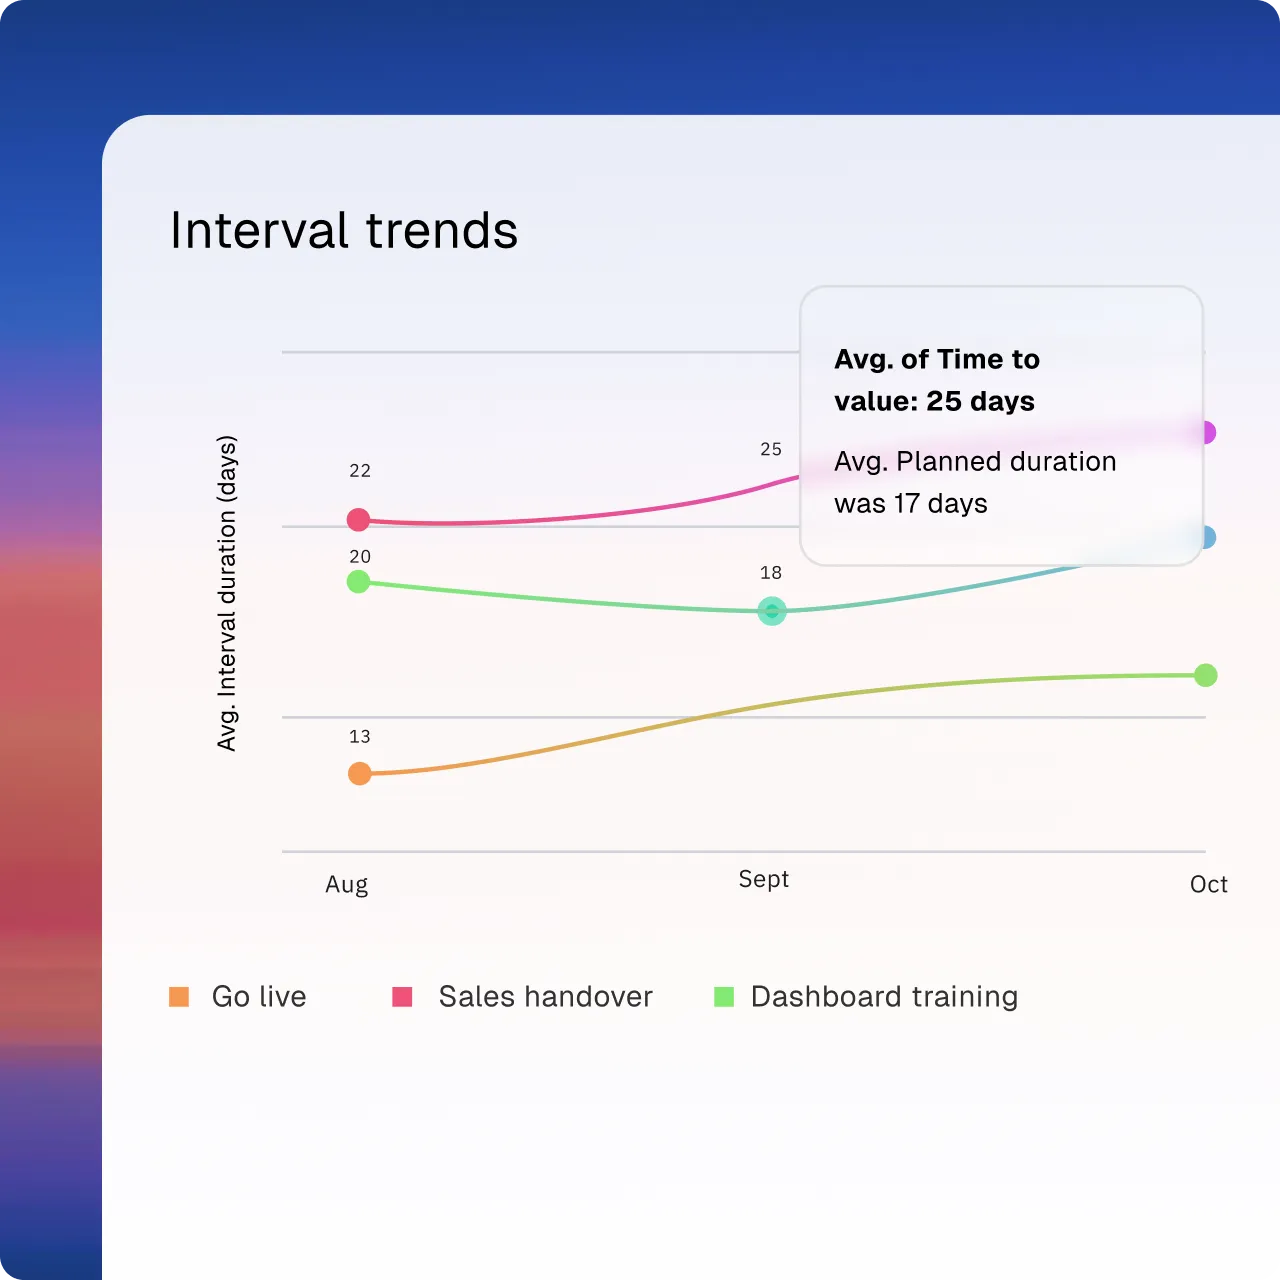
Pave the way for faster time-to-value
Track pacing against key milestones across every project and see which ones are on track and which are slipping.
Interval IQ surfaces the patterns behind delays so you can fine-tune your processes and consistently hit time to value targets.
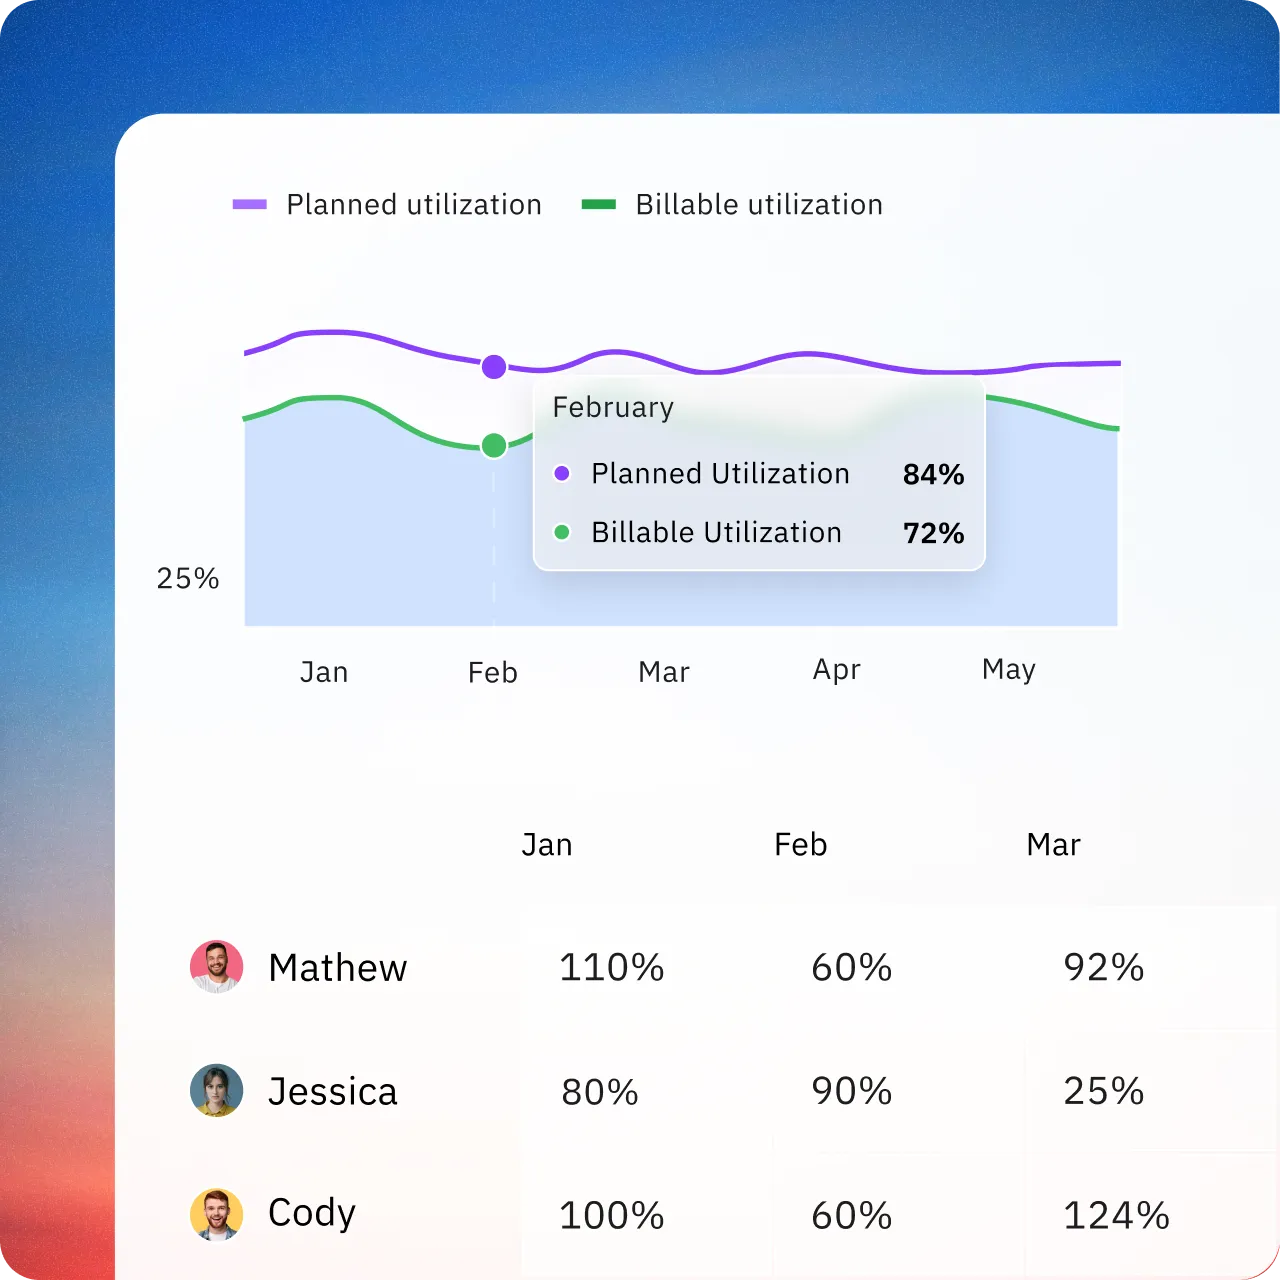
Monitor and optimize your team’s utilization
See how your team's time is distributed across billable, non-billable, and unproductive work.
Spot underutilization and overallocation early, align resources to project demand, and make steady improvements to optimize billable utilization over time.
Enhance services through ongoing CSAT tracking
Keep a constant pulse on customer satisfaction by measuring CSAT at key project milestones, not just in retrospect.
Refine your delivery process in real-time, ensuring your team is fully aligned to deliver exceptional service, and keep those 5-star ratings rolling in!
Customize reports and dashboards in a jiffy
Say goodbye to the days of scrambling for data at month's end, or performing endless vlookups.
Effortlessly consolidate all your crucial reports in a one place, and spot trends that once felt out of reach.

Get an accurate real-time of where things stand at any given point of time
Book a demo

Forecast your hiring pipeline accurately
Get a real-time snapshot of demand versus supply, including holidays and time-offs—providing an up-to-date, precise view to plan your hiring needs. Zoom in on your team’s workload by tracking utilization rates to pinpoint exactly where you need more hands on deck.
Monitor and optimize your team’s utilization
Analyze trends in your team’s utilization rates, and align your resources with project demands. The utilization report offers a clear, concise categorization of time spent, helping you quickly identify issues and prioritize efforts on billable and productive tasks.
Understand where plans and actuals don’t match up
Compare estimated effort against actual time by phase and project type. See where you consistently miss, and carry that learning into future templates and forecasts so staffing, timelines, and margins become more predictable.
Enter the agentic world of services with Rocketlane
Experience how delivery feels when AI agents work beside you - faster timelines, leaner budgets, and scale that once felt out of reach.


Copyright © 2025 Rocketlane Corp. All rights reserved.


